The Holy Grail Setup: A 50-Week Moving Average Retest
The Holy Grail setup is a weekly-timeframe continuation pattern that occurs when a leading stock pulls back to within 0 to 3% of its rising 50-week moving average following a breakout from a prior consolidation base. It identifies low-risk entry zones where long-term institutional accumulation typically resumes, confirmed by positive relative strength and constructive volume.
Technical Concept & Anatomy
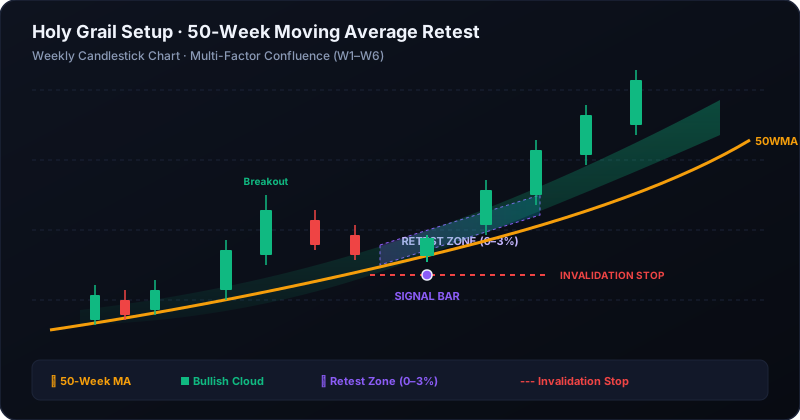
- Holy Grail Setup Definition
- Price returns to within 0–3% of a rising 50-week moving average (50WMA) after completing an initial breakout, allowing for a disciplined entry where risk can be clearly defined against the moving average support line.
When a quality equity breaks out of a multi-month consolidation, early momentum can cause price to extend far beyond fair value. Chasing extended stocks exposes investors to painful pullbacks. The Holy Grail setup waits patiently for that inevitable pullback to the institutional trendline—the 50-week moving average.
Confluence Criteria
- Trend Direction: The 50-week moving average must be sloping upward, establishing a structural bull market.
- Retest Proximity: Weekly closing price sits comfortably in the retest zone (0–3% above the 50WMA).
- Relative Strength: Mansfield Relative Strength indicates outperformance versus the benchmark S&P 500 index.
- Momentum Indicator: Relative Strength Index (RSI) holds above 50, indicating bullish momentum without being overheated.
What Invalidates the Setup?
A setup is only as good as its invalidation condition. The Holy Grail thesis is invalidated when:
- Weekly Close Below 50WMA: A decisive weekly close below the 50-week moving average indicates that institutional support has failed.
- Deteriorating Relative Strength: The stock begins severely lagging the benchmark index.
- Breakdown on Heavy Volume: High-volume selling through the moving average indicates institutional distribution.