Case Study: AMD 2025 Holy Grail 50WMA Retest
In June 2025, Advanced Micro Devices (AMD) completed a textbook Holy Grail setup as price pulled back cleanly to test a rising 50-week moving average near $143 following a major consolidation base. The setup demonstrated strong relative strength against the S&P 500 and a bullish EMA cloud flip, preceding a powerful multi-month expansion to $557.
Performance Notice: Outcome figures shown (+288%) represent an exceptional historical case study and are not typical. Stock market investing involves significant risk. Always review our Value Trap Case Study to understand setup failures.
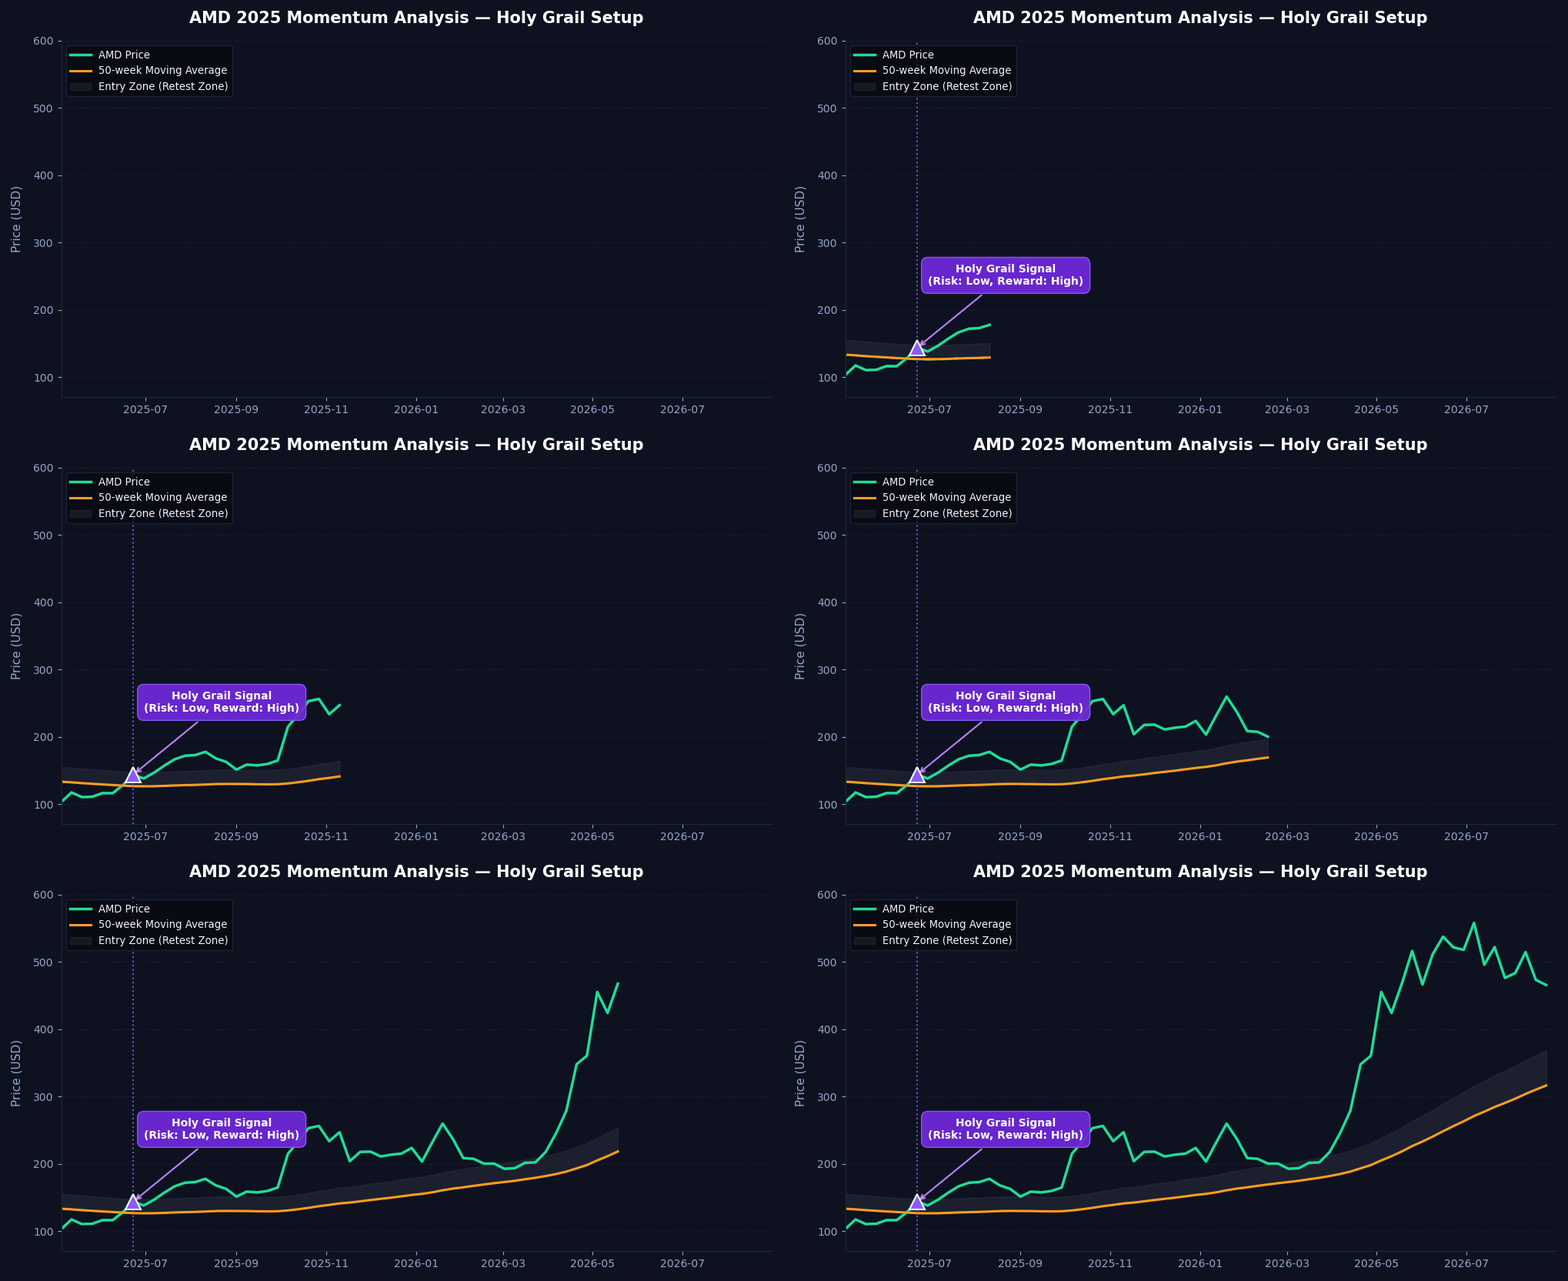
Technical Context at the Signal
| Metric | Recorded Value |
|---|---|
| Ticker | AMD (NASDAQ) |
| Signal Date | June 13, 2025 |
| Weekly Signal Close | $143.20 |
| 50-Week Moving Average | $140.10 (Rising) |
| Retest Proximity | +2.2% above 50WMA |
| Mansfield RS vs. SPX | Positive / Expanding |
| Defined Invalidation Stop | $140.00 (Weekly close below 50WMA) |
| Outcome (as of Jan 16, 2026) | Peak $557.00 (+288%) |
Technical Anatomy of the Move
- Prior Consolidation: AMD formed a constructive weekly base over multiple quarters, digesting prior gains.
- Orderly Pullback: Price drifted down on declining weekly volume toward the rising 50-week moving average at $140.10.
- Buyer Defense: Institutional accumulation stepped in directly in the 0–3% retest window, producing a strong weekly reversal bar.
- Follow-Through: Confirmed by expanding Mansfield RS against the benchmark S&P 500.