The HolyGrail Technical Methodology: A Weekly Momentum Framework
The HolyGrail methodology is an educational technical analysis framework designed to identify high-probability momentum continuations in US public equities. It evaluates stocks on a weekly timeframe, focusing on stocks holding above a rising 50-week moving average, measuring relative strength against the S&P 500, and requiring defined invalidation levels to manage downside risk.
Important Notice: The descriptions on this page outline the conceptual framework behind weekly momentum investing for educational purposes. HolyGrail does not publish proprietary scanning weights or algorithmic formulas. All technical setups can fail; disciplined stop-loss and risk management are required. See Disclaimers.
Core Technical Foundations
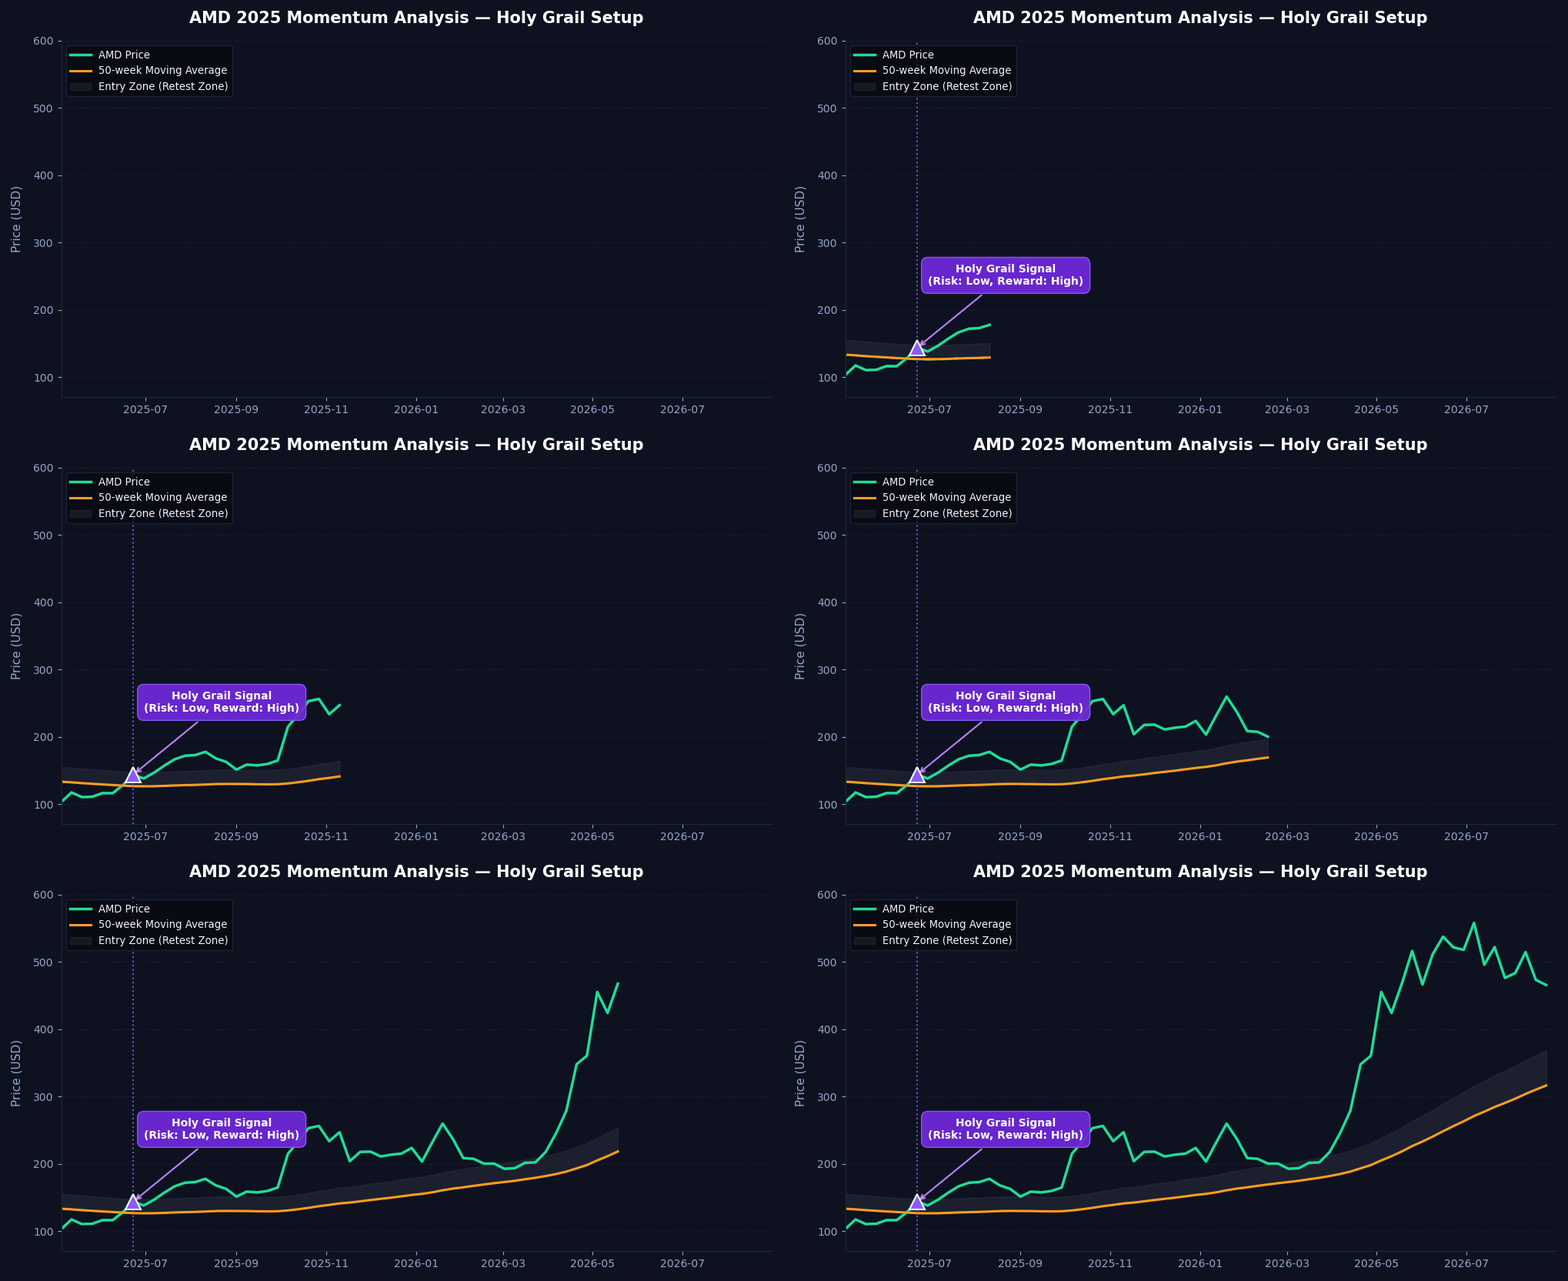
The methodology rests on four interconnected technical pillars:
- 1. Long-Term Institutional Trend (50WMA)
- Major institutions benchmark long-term performance across quarters. The 50-week moving average (~250 trading days) serves as the primary dividing line between secular accumulation and distribution. A stock must be trading above a rising 50WMA to be considered in a constructive structural uptrend.
- 2. The Retest Zone
- Breakouts that extend far above their moving averages carry heightened risk of sharp mean-reversion. The ideal low-risk entry window occurs when price pulls back toward the 50WMA (the retest zone), allowing buyers to enter with a defined support floor rather than chasing extended prices.
- 3. Relative Strength vs. S&P 500
- True momentum leaders do not simply rise with the broader market—they outperform it. We evaluate whether a stock's weekly performance outpaces the benchmark S&P 500 index over multiple months.
- 4. Non-Hindsight Invalidation
- Every setup must have an objective price point where the thesis is proven false. If price closes decisively below its designated moving average or breaks prior consolidation lows, the setup is invalidated immediately.
Universe Coverage & Scan Cadence
HolyGrail monitors three standard US equity universes:
- S&P 500: Large-cap institutional equities with deep liquidity.
- Russell 1000: Broad large- and mid-cap US equities.
- Russell 2000: Small-cap growth and cyclical opportunities.
What the Methodology Does Not Do
- No Price Guarantees: Technical patterns reflect historical probabilities, not certainties.
- No Intraday Execution: The framework is not designed for day trading or scalping.
- No Replacement for Risk Management: A setup without an invalidation stop is gambling. Always define downside before considering upside.