Case Study: ARM 2026 Weekly Momentum Retest
In March 2026, ARM Holdings completed a high-momentum 50-week moving average retest following a multi-month consolidation base. Price pulled back to test institutional support at $118.38, stabilized along its rising 50WMA baseline, and resumed an explosive upward trajectory with substantial Mansfield relative strength outperformance, peaking at $452.70.
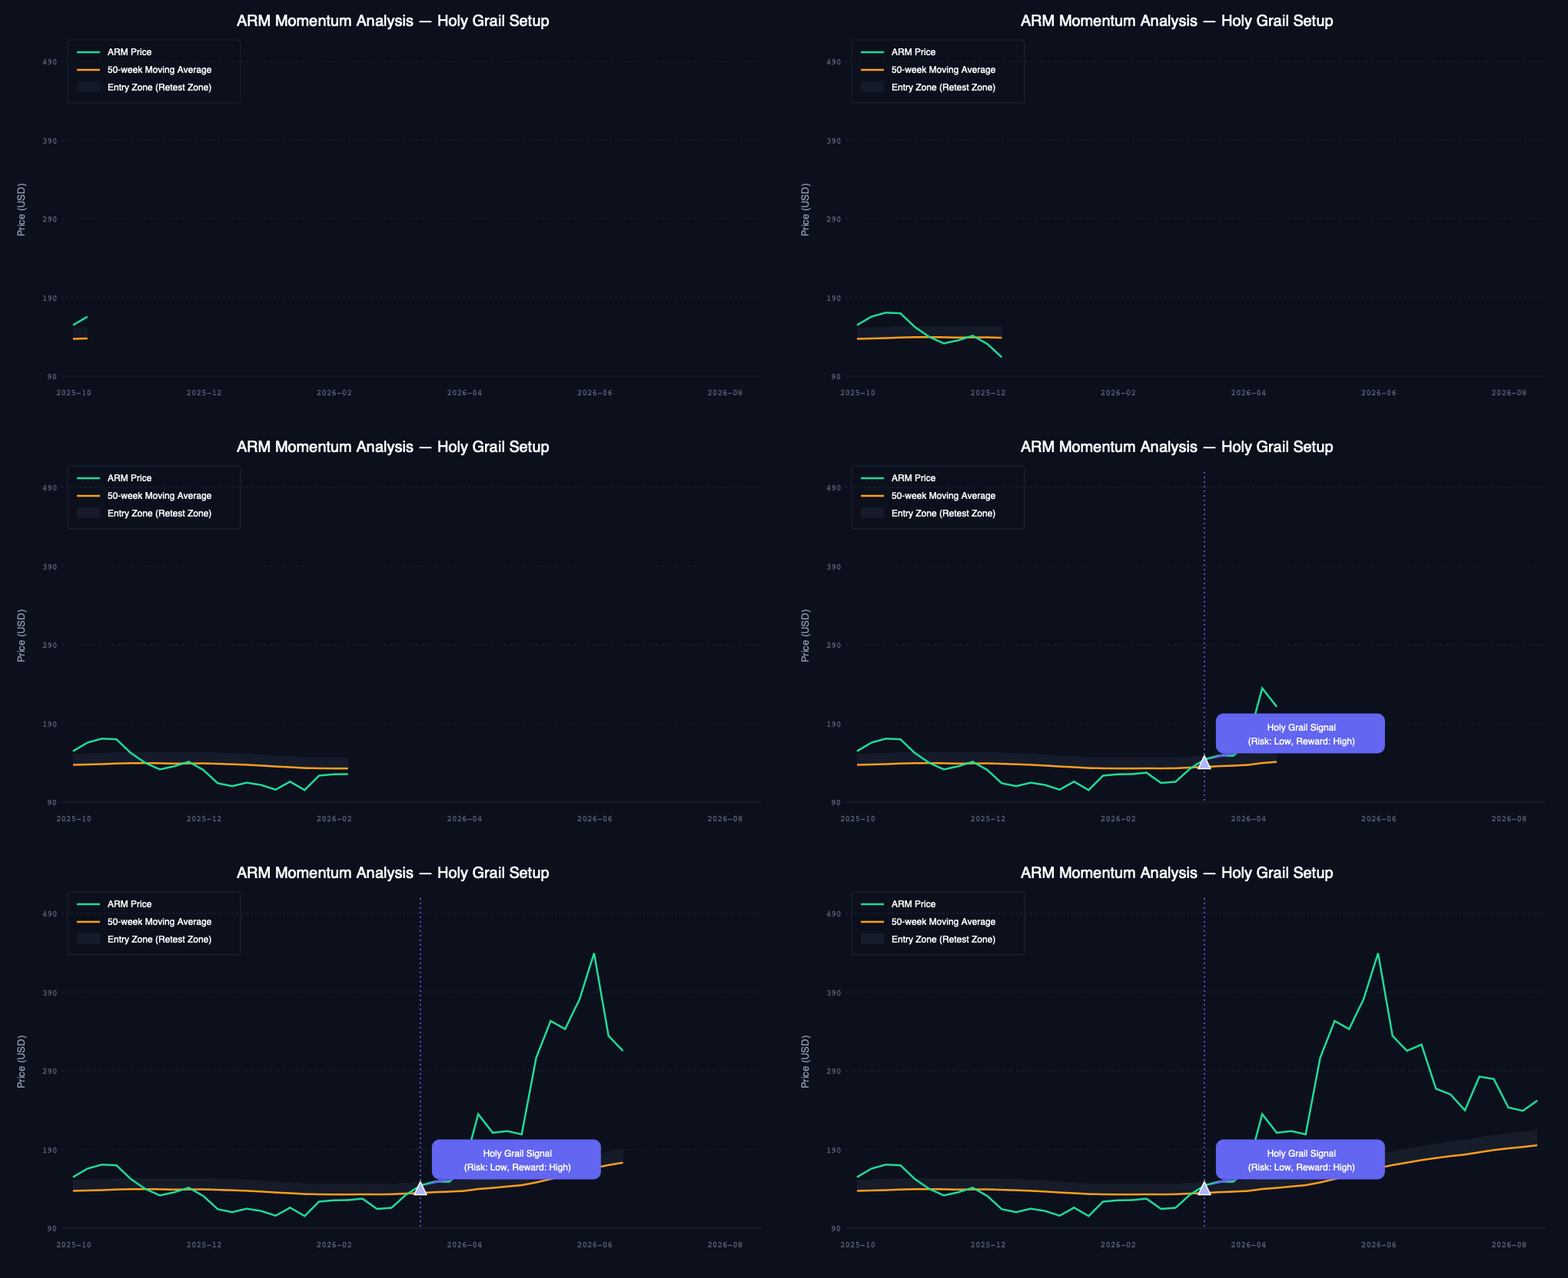
Technical Context at the Signal
| Metric | Recorded Value |
|---|---|
| Ticker | ARM (NASDAQ) |
| Signal Date | March 16, 2026 |
| Weekly Retest Low | $118.38 |
| Weekly Signal Close | $132.35 |
| 50-Week Moving Average | $133.90 |
| Mansfield RS vs. SPX | Expanding Positive Momentum |
| Subsequent Peak (June 2026) | Peak $452.70 (+282%) |
See Holy Grail Setup and Disclaimer.