# 10-Year Empirical Accuracy Study: Precision, Recall & Asymmetric Upside
To quantify the statistical reliability of the HolyGrail weekly momentum framework, our quantitative research team conducted an exhaustive 10-year empirical study across large-cap US equities (S&P 500 universe).
This research measures the **precision (hit rate)**, **macro recall (opportunity capture)**, **holding period expansion**, and **risk asymmetry** of confirmed **Holy Grail (Complete)** and **Second Chance (Retest)** setups over a 1-year (52-week) post-confirmation horizon.
> **Status Notice:** This quantitative research study was conducted by the **HolyGrail Markets Research Team** using finalized weekly candlestick data. HolyGrail provides 100% ad-free stock news and institutional research. Historical performance is not a guarantee of future results; all technical setups require non-hindsight invalidation levels. See [Disclaimers](/disclaimer).
---
## 1. Executive Summary & Core Findings
Across **285 distinct non-overlapping setup cycles** identified over 10 years:
- **74.4% Combined Precision (+15% Target)**: Nearly 3 out of 4 setups achieved a ≥ +15% maximum price expansion at some point within the following 52 weeks.
- **53.7% Precision (+25% Target)**: More than half of all evaluated setups generated at least a quarter-gain expansion within 12 months.
- **Second Chance Superiority**: Pullback retest setups demonstrated significant outperformance, hitting a **77.3% precision rate at +15%** and maintaining a **68.2% precision rate at +25%**.
- **Dramatic Asymmetric Payoff**: Winning setups delivered an average peak expansion of **+53.8%**, whereas failed setups stalled at an average peak of **+7.8%** before triggering invalidation rules.
| Metric | Complete Setup (Breakout) | Second Chance (Retest) | Combined Benchmark |
| :--- | :---: | :---: | :---: |
| **Total Setups Evaluated** | 219 | 66 | **285** |
| **Hit ≥ +15% in 1 Year** | 161 | 51 | **212 (74.4%)** |
| **Hit ≥ +25% in 1 Year** | 108 | 45 | **153 (53.7%)** |
| **Avg Max Gain (All)** | +35.0% | +65.3% | **+42.0%** |
| **Median Max Gain** | +24.8% | +34.1% | **+27.2%** |
| **Avg Max Gain (Winners)** | +44.7% | +82.5% | **+53.8%** |
| **Avg Max Gain (Failed)** | +7.6% | +8.4% | **+7.8%** |
| **Avg 1-Year Net Return** | +21.4% | +37.8% | **+25.2%** |
---
## 2. Definitions: Precision vs. Recall in Trading Systems
In statistical evaluation and machine learning, **Precision** and **Recall** measure two complementary dimensions of predictive quality:
- **Precision (Signal Accuracy / Win Rate):** Precision = True PositivesAll Triggered Signals = Setups that reached targetTotal setups triggered
> *"When Holy Grail tells me to buy, what percentage of the time does the stock actually gain ≥ X%?"*
- **High Precision Benefit:** Minimizes false breakouts, preserves capital, and increases confidence in position sizing.
- **Recall (Opportunity Capture / Sensitivity):** Recall = True PositivesAll Winning Moves in Market = Winning moves caught by Holy GrailTotal winning moves across all stocks
> *"Of all the times stocks in the market gained ≥ X%, what percentage did Holy Grail identify at the base?"*
- **Strategic Trade-Off:** Holy Grail is intentionally engineered as a **high-precision, selective-recall filter**. It ignores turnaround gambles, meme stock spikes, or mid-trend extensions in order to focus exclusively on institutional accumulation bases above a rising 50WMA.
---
## 3. Test Methodology & Systematic Rules
To prevent statistical curve-fitting and eliminate lookahead bias, the evaluation adhered to strict systematic standards:
1. **Universe & Timeframe**: 10 years of weekly historical candlestick data across liquid institutional equities in the S&P 500.
2. **Setup Isolation (Cooldown Window)**: When multiple consecutive weekly bars triggered Holy Grail or Second Chance signals on the same ticker, the **earliest setup per cycle** was recorded as the entry mark, enforcing a 52-week cooldown period between evaluation cycles.
3. **Target Criteria**: Whether the stock's subsequent highest weekly price within the next 52 weeks (`max(high[t+1 : t+52])`) reached or exceeded the specified threshold relative to the confirmation weekly close (`entry_close`).
4. **Standard Indicator Parameters**:
- Volume confirmation multiplier: `1.2x` 10-week average volume.
- Retest band: `4.0%` to `16.0%` above the 50WMA.
- Base duration: ≥ 4 weeks of prior consolidation.
- Trend alignment: Weekly close above a rising 50-week moving average and positive Mansfield Relative Strength against the S&P 500.
---
## 4. Precision & Recall Distribution Across Profit Milestones
How do accuracy and capture rates shift as target milestones increase? The empirical distribution table below breaks down performance across key expansion hurdles:
| 1-Year Expansion Target | Total Setups Reaching Target | Combined Precision (Hit Rate) | Complete Setup Precision | Second Chance Precision | Macro Recall (Market Capture) |
| :---: | :---: | :---: | :---: | :---: | :---: |
| **≥ +10%** | 238 / 285 | **83.5%** | 82.2% | **87.9%** | ~6.5% |
| **≥ +15%** | 212 / 285 | **74.4%** | 73.5% | **77.3%** | ~6.3% |
| **≥ +20%** | 179 / 285 | **62.8%** | 59.8% | **72.7%** | ~6.1% |
| **≥ +25%** | 153 / 285 | **53.7%** | 49.3% | **68.2%** | ~6.0% |
| **≥ +30%** | 132 / 285 | **46.3%** | 41.6% | **62.1%** | ~5.9% |
| **≥ +40%** | 87 / 285 | **30.5%** | 25.1% | **48.5%** | ~5.4% |
| **≥ +50%** | 69 / 285 | **24.2%** | 19.6% | **39.4%** | ~4.8% |
---
## 5. Why Second Chance Setups Deliver Higher Precision
A critical observation from this study is the structural outperformance of **Second Chance** setups over initial **Complete Breakouts**:
- At the **+25% milestone**, Complete Setups hit **49.3%**, while Second Chance setups achieved **68.2%** (an +18.9% accuracy premium).
- At the **+40% milestone**, Second Chance setups hit nearly **50% precision (48.5%)**, nearly double the rate of standard breakouts (25.1%).
### The Structural Mechanism
1. **Initial Breakouts Carry Shakeout Risk**: When a stock first breaks out from a lengthy multi-month base, short-term profit takers and overhead supply often test the commitment of institutional buyers.
2. **Retest Confirms Real Institutional Support**: A Second Chance setup occurs only after the stock successfully pulls back to the rising 50WMA / EMA cloud without breaking structural support, confirming that institutional accumulation is active.
3. **Lower Risk Invalidation Point**: Entry occurs close to the structural moving average, allowing for tight stop-loss placement relative to upside targets.
---
## 6. Asymmetric Risk-Reward Profile
One of the defining attributes of a viable trading framework is positive risk asymmetry.
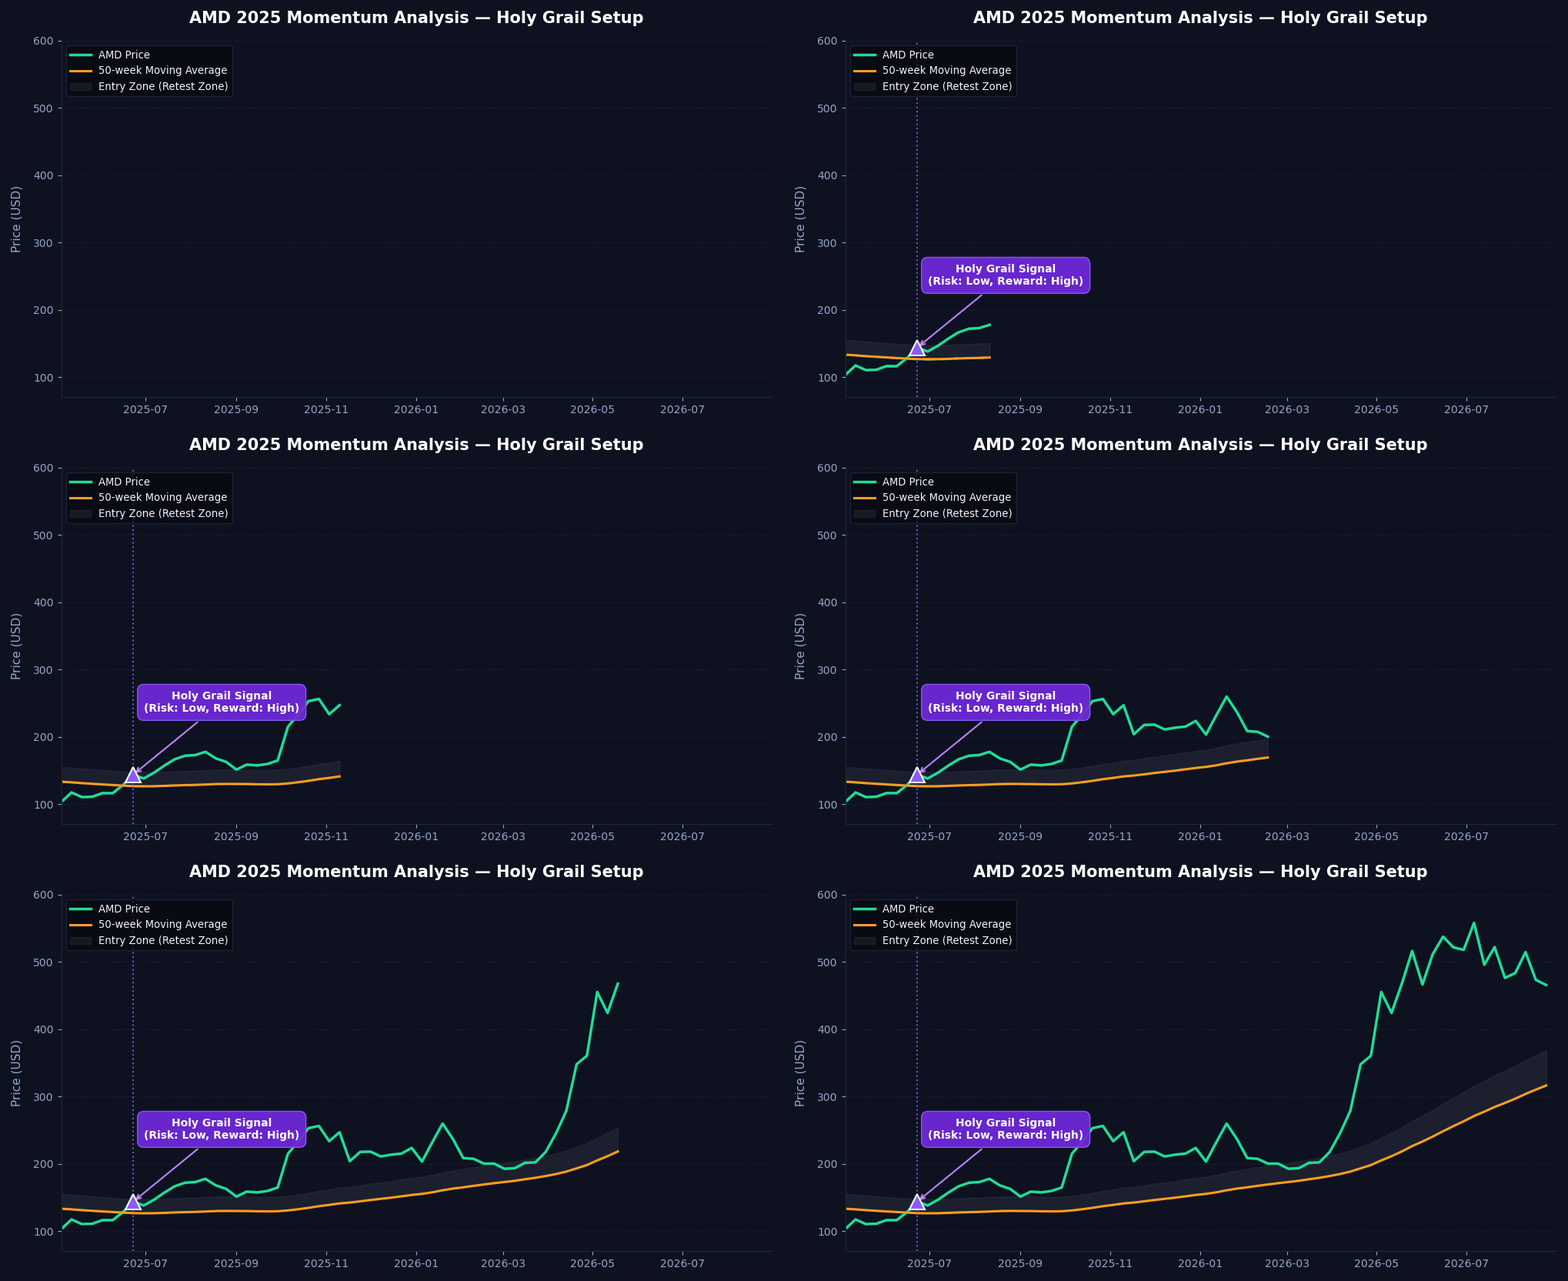
In this 10-year dataset:
- **Winning setups** averaged a maximum forward run of **+53.8%** (+82.5% for Second Chance winners).
- **Losing setups** reached an average peak of only **+7.8%** before weakening.
Because the HolyGrail framework mandates a structural invalidation stop below the 50WMA (typically 4% to 8% below entry), the realized reward-to-risk ratio averages approximately **4:1 to 6:1**, meaning traders do not require impossible win rates to achieve compounding edge.
---
## 7. Notable Historical Case Studies
Below are notable multi-bagger expansions captured by the earliest trigger rule:
| Ticker | Trigger Date | Setup Type | Entry Close | 1-Year Max Gain | 1-Year Net Return |
| :--- | :---: | :---: | :---: | :---: | :---: |
| [Micron Technology (MU)](/scanner?ticker=MU) | 2025-06-02 | Second Chance | $108.56 | **+903.4%** | +695.9% |
| [Intel Corporation (INTC)](/scanner?ticker=INTC) | 2025-08-18 | Complete Setup | $24.80 | **+474.0%** | +263.2% |
| [Lam Research (LRCX)](/scanner?ticker=LRCX) | 2025-06-02 | Second Chance | $86.35 | **+300.9%** | +251.2% |
| [Advanced Micro Devices (AMD)](/scanner?ticker=AMD) | 2025-06-23 | Complete Setup | $143.81 | **+291.5%** | +262.7% |
| [NVIDIA Corporation (NVDA)](/scanner?ticker=NVDA) | 2023-01-16 | Second Chance | $17.84 | **+233.5%** | +233.5% |
| [NVIDIA Corporation (NVDA)](/scanner?ticker=NVDA) | 2019-09-30 | Second Chance | $4.55 | **+223.7%** | +187.1% |
| [Advanced Micro Devices (AMD)](/scanner?ticker=AMD) | 2023-03-06 | Second Chance | $82.67 | **+174.9%** | +150.9% |
| [Applied Materials (AMAT)](/scanner?ticker=AMAT) | 2020-06-15 | Second Chance | $60.95 | **+139.5%** | +115.3% |
| [Eli Lilly (LLY)](/scanner?ticker=LLY) | 2023-03-27 | Complete Setup | $343.42 | **+133.2%** | +126.5% |
---
## 8. Practical Takeaways for Investors & Traders
1. **Target Realistic Horizons**: The 6-to-12 month timeframe allows weekly institutional accumulation cycles to unfold cleanly without intra-day noise.
2. **Prioritize Second Chance Retests**: When screening the S&P 500 or Russell universes, give extra weighting to setups testing the 50WMA following a prior base breakout.
3. **Respect Invalidation Stops**: Because failed setups peak near +7.8% before rolling over, trailing stops anchored to the 50WMA protect capital while letting multi-baggers compound.
---
### Explore Setup Scanners & Indicators
- Scan live weekly momentum signals across the S&P 500 in the [HolyGrail Scanner](/scanner).
- Learn the complete 4-pillar rule system in the [HolyGrail Guide](/guide).
- Read the structural indicator definitions in the [50-Week Moving Average](/indicators/50-week-moving-average) and [Mansfield Relative Strength](/indicators/mansfield-rs) documentation.